The Colony of Tampere sub-region
By The People For The People
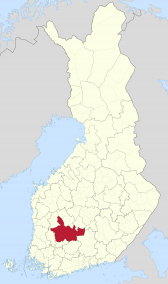
Region: Sub regions of Finland
Quicksearch Query: Tampere sub-region
|
Quicksearch: | |
NS Economy Mobile Home |
Regions Search |
Tampere sub-region NS Page |
|
| GDP Leaders | Export Leaders | Interesting Places BIG Populations | Most Worked | | Militaristic States | Police States | |
By The People For The People
Region: Sub regions of Finland
Quicksearch Query: Tampere sub-region
| Tampere sub-region Domestic Statistics | |||
|---|---|---|---|
| Government Category: | Colony | ||
| Government Priority: | Defence | ||
| Economic Rating: | Thriving | ||
| Civil Rights Rating: | Some | ||
| Political Freedoms: | Superb | ||
| Income Tax Rate: | 5% | ||
| Consumer Confidence Rate: | 100% | ||
| Worker Enthusiasm Rate: | 103% | ||
| Major Industry: | Gambling | ||
| National Animal: | kangaroo | ||
| Tampere sub-region Demographics | |||
| Total Population: | 141,000,000 | ||
| Criminals: | 14,755,047 | ||
| Elderly, Disabled, & Retirees: | 20,967,493 | ||
| Military & Reserves: ? | 15,358,140 | ||
| Students and Youth: | 22,560,000 | ||
| Unemployed but Able: | 21,772,460 | ||
| Working Class: | 45,586,860 | ||
| Tampere sub-region Government Budget Details | |||
| Government Budget: | $500,370,914,000.24 | ||
| Government Expenditures: | $490,363,495,720.24 | ||
| Goverment Waste: | $10,007,418,280.00 | ||
| Goverment Efficiency: | 98% | ||
| Tampere sub-region Government Spending Breakdown: | |||
| Administration: | $68,650,889,400.83 | 14% | |
| Social Welfare: | $0.00 | 0% | |
| Healthcare: | $83,361,794,272.44 | 17% | |
| Education: | $0.00 | 0% | |
| Religion & Spirituality: | $0.00 | 0% | |
| Defense: | $205,952,668,202.50 | 42% | |
| Law & Order: | $83,361,794,272.44 | 17% | |
| Commerce: | $53,939,984,529.23 | 11% | |
| Public Transport: | $0.00 | 0% | |
| The Environment: | $0.00 | 0% | |
| Social Equality: | $0.00 | 0% | |
| Tampere sub-regionWhite Market Economic Statistics ? | |||
| Gross Domestic Product: | $456,209,000,000.00 | ||
| GDP Per Capita: | $3,235.52 | ||
| Average Salary Per Employee: | $6,700.00 | ||
| Unemployment Rate: | 22.82% | ||
| Consumption: | $2,759,905,758,412.80 | ||
| Exports: | $401,182,811,136.00 | ||
| Imports: | $406,285,418,496.00 | ||
| Trade Net: | -5,102,607,360.00 | ||
| Tampere sub-region Non Market Statistics ? Evasion, Black Market, Barter & Crime | |||
| Black & Grey Markets Combined: | $224,860,766,239.24 | ||
| Avg Annual Criminal's Income / Savings: ? | $1,788.68 | ||
| Recovered Product + Fines & Fees: | $28,669,747,695.50 | ||
| Black Market & Non Monetary Trade: | |||
| Guns & Weapons: | $23,484,064,919.69 | ||
| Drugs and Pharmaceuticals: | $9,505,454,848.44 | ||
| Extortion & Blackmail: | $13,978,610,071.24 | ||
| Counterfeit Goods: | $27,398,075,739.63 | ||
| Trafficking & Intl Sales: | $0.00 | ||
| Theft & Disappearance: | $9,505,454,848.44 | ||
| Counterfeit Currency & Instruments : | $29,075,508,948.18 | ||
| Illegal Mining, Logging, and Hunting : | $0.00 | ||
| Basic Necessitites : | $0.00 | ||
| School Loan Fraud : | $0.00 | ||
| Tax Evasion + Barter Trade : | $96,690,129,482.87 | ||
| Tampere sub-region Total Market Statistics ? | |||
| National Currency: | rupee | ||
| Exchange Rates: | 1 rupee = $0.40 | ||
| $1 = 2.50 rupees | |||
| Regional Exchange Rates | |||
| Gross Domestic Product: | $456,209,000,000.00 - 67% | ||
| Black & Grey Markets Combined: | $224,860,766,239.24 - 33% | ||
| Real Total Economy: | $681,069,766,239.24 | ||
| Sub regions of Finland Economic Statistics & Links | |||
| Gross Regional Product: | $197,243,101,511,680 | ||
| Region Wide Imports: | $27,237,891,964,928 | ||
| Largest Regional GDP: | Saarijarvi-Viitasaari sub-region | ||
| Largest Regional Importer: | Saarijarvi-Viitasaari sub-region | ||
| Regional Search Functions: | All Sub regions of Finland Nations. | ||
| Regional Nations by GDP | Regional Trading Leaders | |||
| Regional Exchange Rates | WA Members | |||
| Returns to standard Version: | FAQ | About | About | 485,020,451 uses since September 1, 2011. | |
Version 3.69 HTML4. V 0.7 is HTML1. |
Like our Calculator? Tell your friends for us... |